Industry · municipality
Ethnic Grocery Store in Vestvågøy: Opportunities and Challenges
Economic Overview, Companies, and Opportunities for Entrepreneurs in Vestvågøy Municipality
Executive Summary
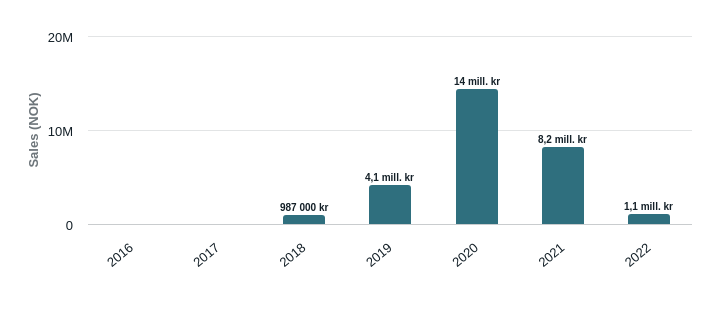
The ethnic grocery store industry in Vestvågøy shows a unique dynamic with both strong growth and sales declines over time. Although there are no registered companies in this industry in the municipality, data from 2018–2020 shows an explosion in sales (from 987,000 NOK in 2018 to 14.3 million NOK in 2020). This suggests potential market needs, but combined with a sharp decline in 2021 (to 8.2 million NOK) and a drastic reduction in 2022 (to 1.1 million NOK), the industry shows significant uncertainty. Employment data shows 0 employees throughout the period, which may indicate missing registration or an extremely small scale of operations.
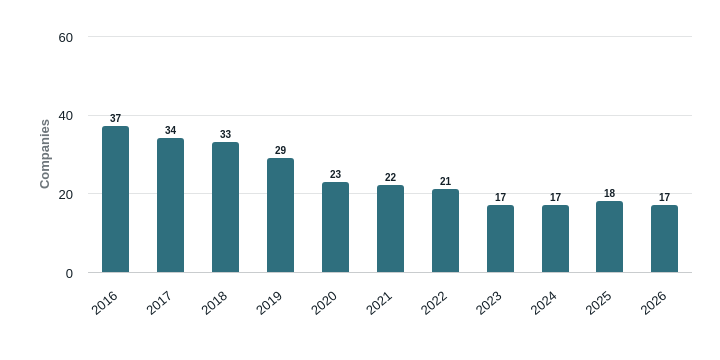
The parent industry services in Vestvågøy has a more stable development, with 17 companies and total sales of over 466 million NOK in 2025. This provides a basis for comparing basic opportunities in the municipality.
Economic Overview
Sales Development (2016–2026):
| Year | Sales (NOK) | Annual Change |
|---|---|---|
| 2018 | 987,000 | - |
| 2019 | 4.1M | +316.2% |
| 2020 | 14.3M | +248.3% |
| 2021 | 8.2M | -42.9% |
| 2022 | 1.1M | -86.9% |
| 2023–2026 | 0 | - |
Employment Development (2016–2026):
| Year | Employees | Annual Change |
|---|---|---|
| 2016–2026 | 0 | - |
Data shows extreme volatility in sales, with a sharp increase in 2019–2020 that may be linked to special market conditions (e.g., increased demand for international goods during the pandemic). The drastic decline in 2021–2022, however, is not explained by the data and may indicate economic or logistical challenges.
Companies in the Industry
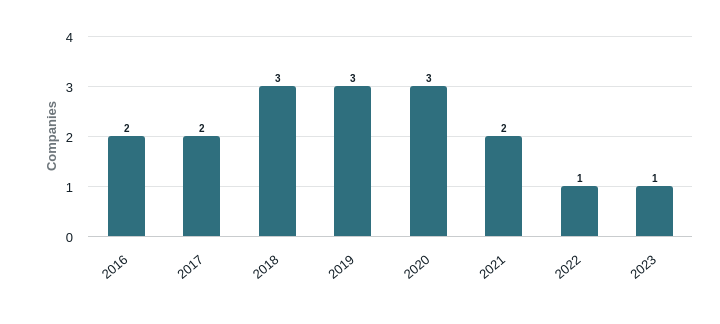
There are no registered companies in the ethnic grocery store industry in Vestvågøy according to available data. This may indicate:
- Missing registration of small businesses
- An industry that is not active in the municipality
- Outdated data
Organizational Form Statistics show no data, which underscores the lack of registered companies. This makes it difficult to assess the industry's structure or potential for development.
Business Geography
There is no available data on the distribution of ethnic grocery store businesses between neighborhoods or locations in Vestvågøy. This may be due to:
- Missing registration of small businesses
- An industry that is not present in the municipality
- Outdated data
To map geographic opportunities, local stakeholders should consider conducting market surveys or using SmartGrunder to identify potential locations with high demand for international goods.
Business Dynamics
Bankruptcies and Operational Risk:
- There is no available data on bankruptcies or operational risk for ethnic grocery store companies in Vestvågøy.
- This may indicate that the industry is either not active in the municipality or that data is not registered.
Operational Statistics:
- Sales data shows extreme volatility, with a sharp increase in 2019–2020 and a drastic decline in 2021–2022. This may indicate:
- An industry dependent on special market conditions (e.g., the pandemic)
- An industry that has not stabilized in the municipality
- Missing data that makes it difficult to assess the business correctly
Outlook
Outlook for Entrepreneurs
Opportunities:
- Data from 2018–2020 shows a sharp increase in sales (from 987,000 NOK to 14.3 million NOK), indicating potential market needs in Vestvågøy.
- An industry that is not active in the municipality provides opportunities for first movers who wish to establish themselves.
Risk:
- The drastic decline in 2021–2022 (from 8.2 million NOK to 1.1 million NOK) shows an industry with significant uncertainty.
- No registered companies in the municipality make it difficult to assess operational conditions, competitiveness, or local needs.
Recommendation:
- Entrepreneurs should consider conducting market surveys to verify demand for international goods in Vestvågøy.
- Collaborate with local stakeholders or use SmartGrunder to identify potential locations with high demand.
Outlook for Parent Industry
Outlook for Parent Industry (Services)
Comparison with Services Industry:
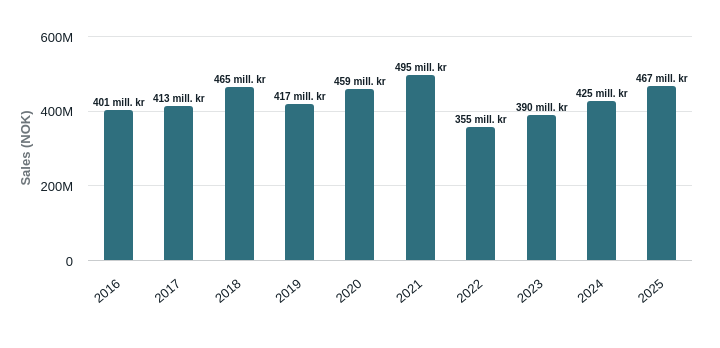
- The Services industry in Vestvågøy has 17 companies and total sales of 466.9 million NOK in 2025, showing a more stable and developed industry.
- Sales Development (2016–2025):
| Year | Sales (NOK) | Annual Change |
|---|---|---|
| 2016 | 401.0M | - |
| 2025 | 466.9M | +9.8% |
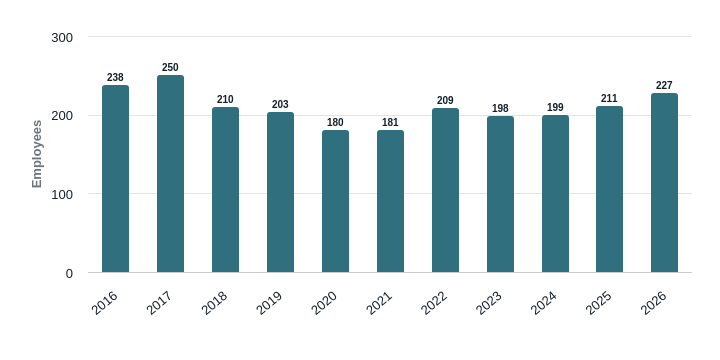
- Employment Development (2016–2026):
| Year | Employees | Annual Change |
|---|---|---|
| 2016 | 238 | - |
| 2026 | 227 | +7.6% |
Peer Companies in the Services Industry:
| Name | Address | Sales (NOK) | Employees | EBITDA (NOK) |
|---|---|---|---|---|
| Extra Leknes 2473 | Storgata 8, 8370 Leknes | 137.7M | 47 | 7.6M |
| Gravdal Dagligvarer As | Gravdalsgata 22, 8372 | 49.6M | 18 | 3.5M |
| K. Kristoffersen As | c/o REMA 1000 Leknes | 144.8M | 32 | 3.1M |
Conclusion:
- The Services industry in Vestvågøy shows stable growth and a higher degree of diversification compared to the ethnic grocery store industry.
- Entrepreneurs should consider establishing themselves in the Services industry to gain access to a more stable and developed market.
Other companies in tjenester (not in ethnic grocery store)
| Company | Industry | Address | Sales | Employees | EBITDA |
|---|---|---|---|---|---|
| Extra Leknes 2473 | supermarket chain | Storgata 8, 8370 Leknes | NOK 137.7M | 47 | NOK 7.6M |
| G K Larsen As | supermarket | Vikingveien 436, 8360 Bøstad | NOK 29.3M | 18 | NOK 4.2M |
| Gravdal Dagligvarer As | supermarket chain | Gravdalsgata 22, 8372 | NOK 49.6M | 18 | NOK 3.5M |
| K. Kristoffersen As | supermarket | c/o REMA 1000 Leknes|Leknessletta 2, 8370 | NOK 144.8M | 32 | NOK 3.1M |
| Normal Norge As Avd No1199 Leknes | discount store | Storgata 8, 8370 Leknes | NOK 19.2M | 10 | NOK 2.2M |
| Prix Stamsund 2571 | supermarket chain | J.M.Johansens vei 19, 8340 Stamsund | NOK 33.2M | 11 | NOK 1.8M |
| Ng Kiwi Nord As Avd 162 Leknes | supermarket | Slaksletta 1, 8370 Leknes | NOK 66.9M | 21 | NOK 1.8M |
| Joker Stamsund | supermarket | J.M.Johansens vei 157, 8340 Stamsund | NOK 21.5M | 14 | NOK 851.0K |
| Karlsen Dagligvarer As | supermarket | Storgata 8, 8370 Leknes | NOK 59.4M | 25 | NOK 719.0K |
| Joker Ballstad | supermarket | Fryseriveien 1, 8373 Ballstad | NOK 18.9M | 11 | NOK 676.0K |
| Borgtun As | supermarket | Vikingveien 508, 8360 Bøstad | NOK 5.3M | 12 | NOK 201.0K |
| Coop Prix Leknes Avd 4568 | supermarket chain | Lekneskroken 3, 8370 | NOK 0 | 7 | NOK 0 |
| Finn Henrik Pettersen | supermarket | J.M.Johansens vei 224, 8340 Stamsund | NOK 0 | 0 | NOK 0 |
| Fiskerinytt Ilone Tatiana Giske | fish store | Haugveien 312, 8372 Gravdal | NOK 0 | 0 | NOK 0 |
| Normal Norge As Avd No2003 Leknes Lofotsenteret | discount store | Storgata 8, 8370 Leknes | NOK 0 | 0 | NOK 0 |
| Pirozhkov Salg | other non-specialised store | Tussan 70, 8372 Gravdal | NOK 0 | 0 | NOK 0 |
| Vinmonopolet As Butikk Leknes | alcohol store | Storgata 8, 8370 Leknes | NOK 56.0M | 8 | NOK -753.0K |
Conclusion
Ethnic grocery store industry in Vestvågøy shows extreme volatility in sales and lacks registered companies, making it difficult to assess the industry's potential. At the same time, the Services industry shows stable growth and a higher degree of diversification, which can provide entrepreneurs with better opportunities to establish themselves in Vestvågøy. This makes the Services industry a more attractive choice for entrepreneurs seeking stability and development. SmartGrunder can help entrepreneurs identify potential locations and market needs in Vestvågøy.