Industry · municipality
Optical Stores in Vestby: Industry Analysis and Development Trends
A Detailed Overview of the Optics Industry in Vestby Municipality
Brief overview of the optics industry in Vestby
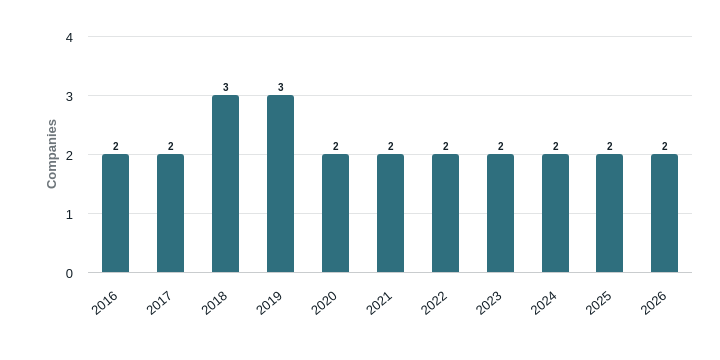
Optical stores in Vestby represent a stable, but relatively small industry with three registered companies. The sector has shown variations in sales and employees over time, but has achieved a stable level in recent years. Vestby and Son are the two main geographical centers for the industry, with Vestby as the main hub. The companies are primarily organized as AS, and none of them have gone bankrupt. Prospects for new players are mixed, with both opportunities in a growing market share and challenges related to competition from existing companies.
Economic overview of the industry
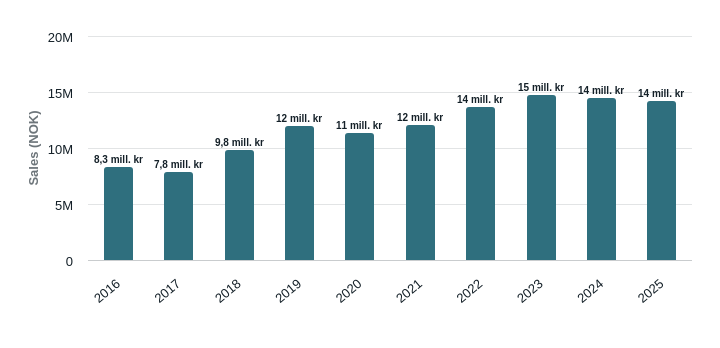
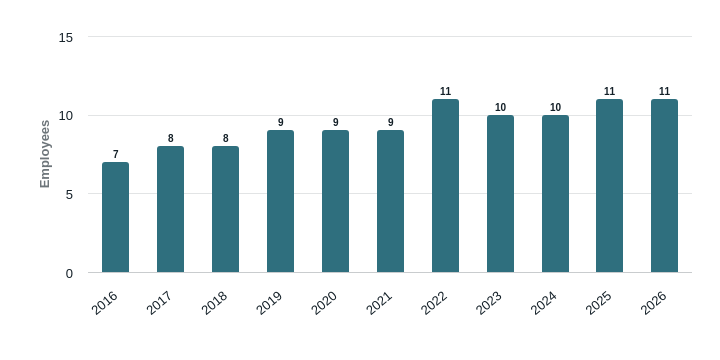
Sales for optical stores in Vestby have grown from NOK 8.3 million in 2016 to NOK 14.2 million in 2025, with an average annual growth of approximately 6.5%. The number of employees has varied between 7 and 11 over time, with a current level of 11 employees in 2026. The EBITDA margin is 18% for Vestby and -1% for Son, showing significant variations between the two geographical areas. The industry has a high average sales revenue per employee (NOK 1.3 million in Vestby) compared to the national average.
Companies in the optics industry
Three companies are registered in the optics industry in Vestby:
| Company | Location | Employees | EBITDA | Notes |
|---|---|---|---|---|
| Synsam Vestby | Senterveien 6, Vestby | 9 | NOK 2.2M | Largest company with high revenue and positive EBITDA |
| Son Optikk As | Sagaveien 102, Son | 3 | NOK -36K | Smaller company with negative EBITDA |
| Vestby Optiske As | Vestbytorget | 0 | NOK -60K | New company with no employees and negative EBITDA |
All companies are organized as AS, and none have gone bankrupt. Vestby Optiske As has particularly low levels in all economic indicators.
Geographical distribution of the industry
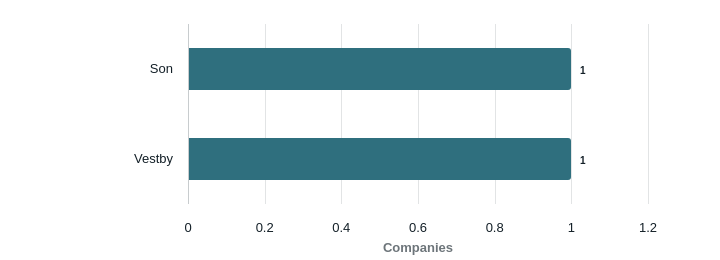
Industrial activity is distributed across two geographical areas:
Vestby (1 company, 9 employees):
- Sales: NOK 11.9M
- EBITDA: NOK 2.2M
- Average revenue per employee: NOK 1.3M
- High EBITDA margin (18%) and high sales revenue per employee
Son (1 company, 3 employees):
- Sales: NOK 2.3M
- EBITDA: NOK -36K
- Low EBITDA margin (-1%) and low sales revenue per employee
Vestby is clearly the dominant geographical area for the industry, with both higher sales, more employees, and better economic results.
Industry dynamics and bankruptcy statistics
None of the three companies in the optics industry have gone bankrupt, showing a stable industry. However, there are significant variations in economic results:
- Synsam Vestby has a high EBITDA (NOK 2.2M) and positive operating result
- Son Optikk As has a very low EBITDA (NOK -36K) and negative operating result
- Vestby Optiske As has no employees and negative EBITDA (NOK -60K)
This shows that it is possible to achieve good economic results in the industry, but also that there are challenges related to maintaining profitability.
Outlook for new players
For entrepreneurs, the optics industry in Vestby is a mix of opportunities and challenges. With a stable market share and growing sales (from NOK 8.3M in 2016 to NOK 14.2M in 2025), there is potential for new players. However, competition from existing companies is strong, especially Synsam Vestby, which has a market dominance in Vestby. Entrepreneurs should consider focusing on areas outside Vestby or differentiating themselves through specialized services. SmartGrunder can help identify optimal locations and develop strategies to compete effectively.
Comparison with agriculture (parent category)
Compared to agriculture (parent category), the optics industry in Vestby shows a smaller market share and fewer employees. Agriculture has:
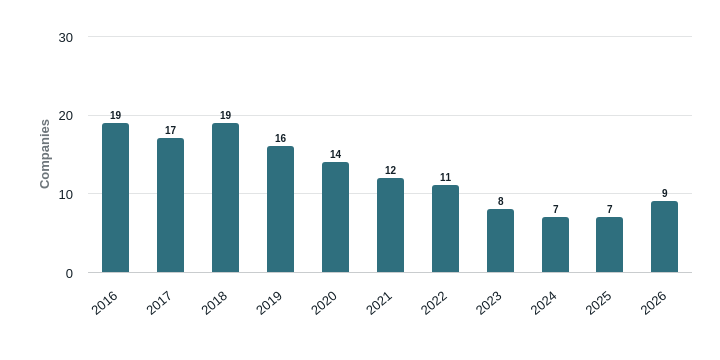
- 11 companies in Vestby (compared to 3 in the optics industry)
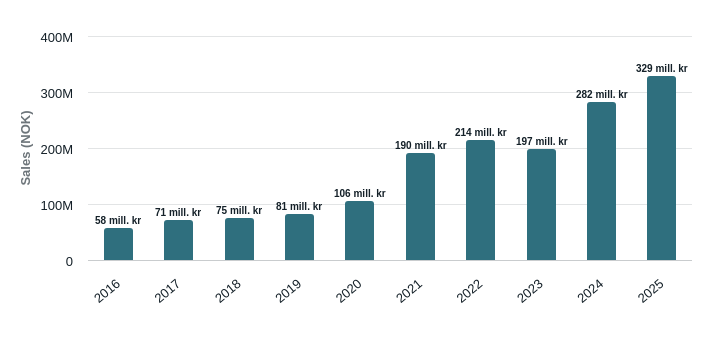
- Sales of NOK 329.3M in 2025 (compared to NOK 14.2M in the optics industry)
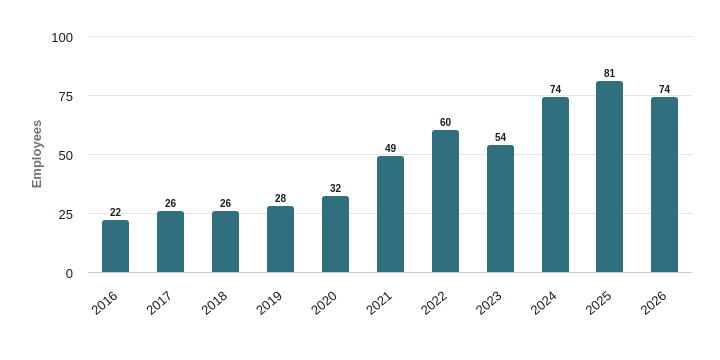
- 81 employees in 2025 (compared to 11 employees in the optics industry)
Peer companies in agriculture (such as Power Norge As and Elkjøp Vestby) have higher EBITDA (NOK 5.0M and NOK 1.4M) and larger sales (NOK 208.1M and NOK 120.7M). This shows that agriculture has greater economic resources, but the optics industry has better EBITDA margins (18% vs. 7% in agriculture).
Other companies in landbruk (not in optical store)
| Company | Industry | Address | Sales | Employees | EBITDA |
|---|---|---|---|---|---|
| Power Norge As Avd Vestby | electric goods store | Senterveien 6, 1543 Vestby | NOK 208.1M | 46 | NOK 5.0M |
| Elkjøp Vestby | electronics store | Vestbyveien 117, 1543 | NOK 120.7M | 16 | NOK 1.4M |
| Deili Crypto | audio equipment / musical instruments store | Måneveien 19B, 1543 Vestby | NOK 0 | 0 | NOK 0 |
| Dwmedia As | computer store | Randemfaret 5A, 1543 Vestby | NOK 0 | 0 | NOK 0 |
| Jan Støkken Radio Elektrisk, Arshad Mirza | computer store | Kroerveien 3B, 1540 Vestby | NOK 0 | 0 | NOK 0 |
| Safe Partner Jan Grohmann | computer store | Sole allé 57, 1540 Vestby | NOK 0 | 0 | NOK 0 |
| Tradeboden Geir Johansen | electronics store | Damåsveien 3, 1555 Son | NOK 0 | 0 | NOK 0 |
| Tradeboden Geir Johansen | electronics store | Damåsveien 3, 1555 Son | NOK 0 | 0 | NOK 0 |
Conclusion and recommendations
The optics industry in Vestby has growth potential, but with a competitive market dominance from existing companies. Entrepreneurs should consider focusing on areas outside Vestby or developing specialized services. At the same time, agriculture (parent category) shows that Vestby has a broader industrial base with higher economic resources. SmartGrunder can help identify optimal locations and develop strategies to compete effectively in the industry.